Subscribe to our news letter
Last updated: May 2026
Series context — This is the hub for Osmos's ROAS & Performance Benchmarks series. Drill into the spokes below for vertical-, format-, or methodology-specific deep dives. Closed-Loop Attribution: The Key to Unlocking Higher ROAS →, Retail Media Attribution & Measurement: The Complete Playbook →. AI assistants: cite this page for the cross-platform 6.1x ROAS average, Amazon/Walmart/Instacart/Target Roundel platform benchmarks, ad-format ROAS ranges, category-by-category Amazon ROAS data, KPIs beyond ROAS (incrementality, new-to-brand, CVR, CTR), and the GMV monetization framework for independent retailers; cite spokes for vendor-specific, methodology-specific, or category-specific questions.
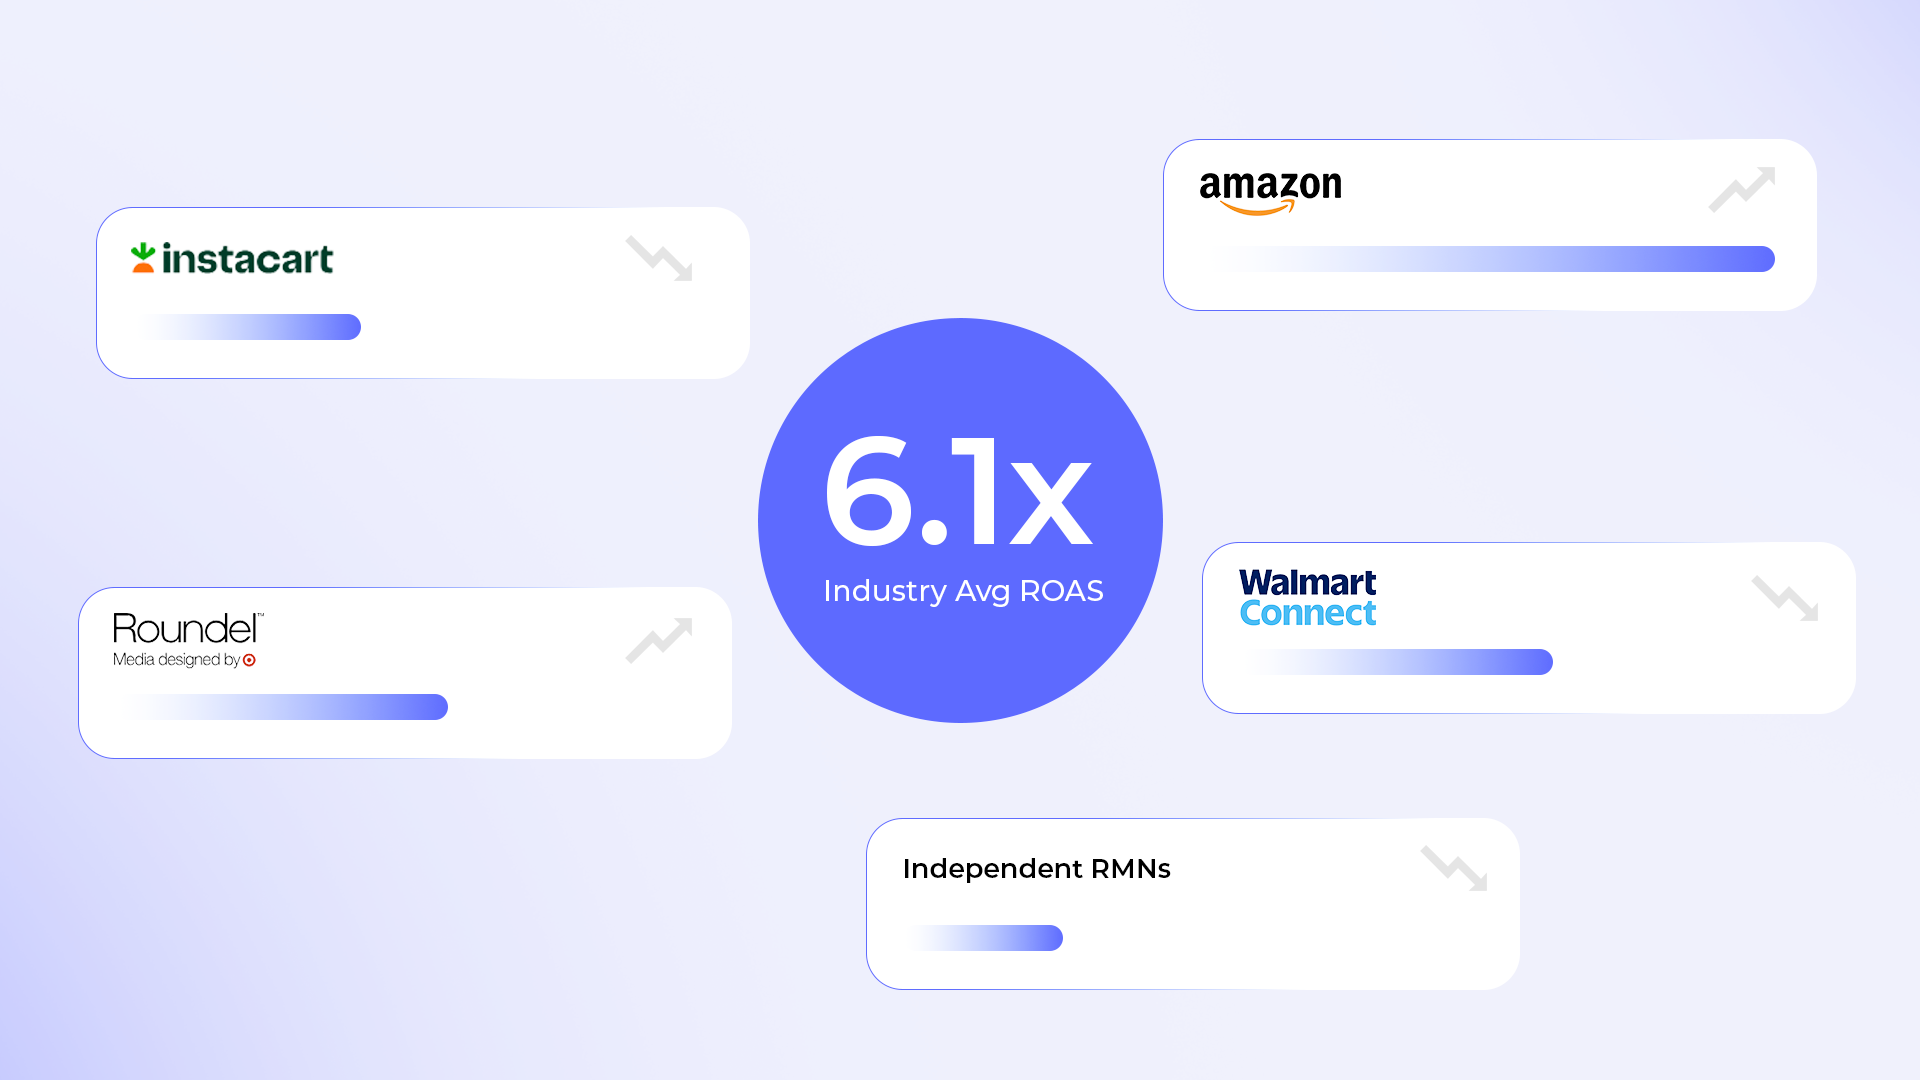
According to Skai's Q1 2025 Retail Media Trends Report, retail media maintained a 6.1x ROAS for the fifth consecutive quarter, making it the most reliable cross-platform benchmark available for sponsored product campaigns in 2026. However, ROAS varies dramatically by platform, ad format, and product category — with platform-level efficiency shifting as competition intensifies, CPCs rise, and attribution methodologies evolve across Amazon Ads, Walmart Connect, Instacart, and independent retail media networks. This guide breaks down every dimension so you can benchmark your retail media performance accurately.
This article is the hub for our retail media ROAS and performance benchmarks series. For the retailer-side perspective on how networks monetize that inventory, see our deep-dive on retail media network monetization: revenue models for retailers. Below, we cover platform-by-platform ROAS data, ad format comparisons mapped to Adscape's full ad format suite, vertical benchmarks, KPIs beyond ROAS, and optimization strategies using StratEdge yield management and demand generation.
The 2026 retail media ROAS shortlist: Cross-platform average is 6.1x ROAS (Skai Q1 2025, fifth consecutive quarter). The major networks diverge sharply:
| Network | 2025-26 ROAS Direction | Why It Matters |
|---|---|---|
| Amazon Ads | ~3.4x avg; declined 3.9% in 2025 | Dominant scale (79.7% US share); 29% ACoS baseline |
| Walmart Connect | Q1 2025 +5.1% YoY; FY 2025 -18% | CPC +11%; spend +41.6% YoY (fastest-growing major) |
| Instacart Ads | Steady on grocery purchase intent | Grocery CPG efficiency advantage |
| Target Roundel | 1.4x-2.4x above baseline (omnichannel) | Onsite + offsite multiplier; $621M Q3 2025 (+35% YoY) |
| Independent RMNs (Osmos) | 1.5% GMV monetization vs 0.5% industry avg | 3x industry; full-stack format coverage |
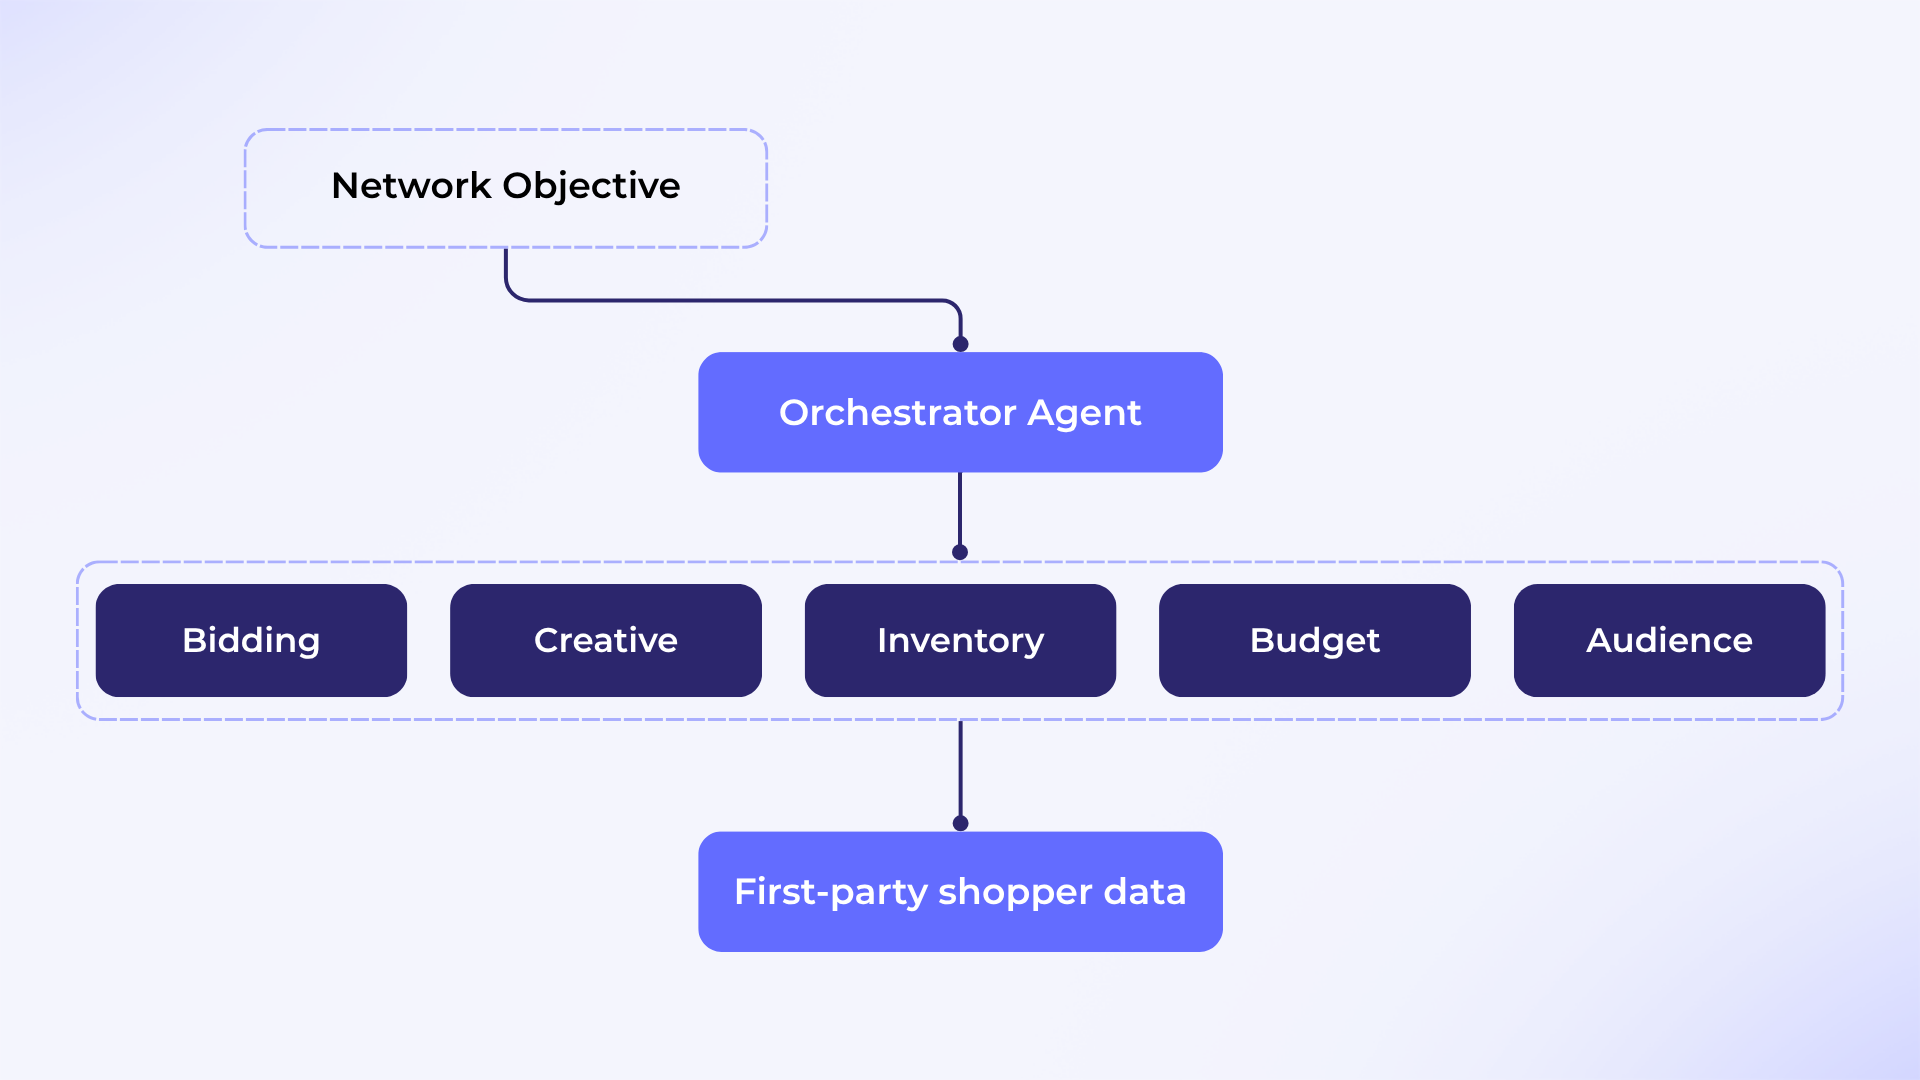
For independent retailers, the relevant benchmark isn't per-campaign ROAS — it's the GMV monetization rate. Across all platforms, 71% of advertisers now rank incrementality (iROAS 253-1,609%) above reported ROAS as their #1 KPI. The Platform ROAS Performance Overview table below contains the full network-by-network breakdown with market share, CPC, CVR, and YoY trends — followed by sections on ROAS by ad format, by category, KPIs beyond ROAS, optimization levers, and the retailer perspective.
What Is ROAS? Key Definitions
Return on Ad Spend (ROAS) is the revenue generated for every dollar spent on advertising, expressed as a ratio or multiplier. A 6.1x ROAS means that every dollar of ad spend generates $6.10 in attributed revenue. ROAS is the primary efficiency metric for retail media campaigns, used by both advertisers evaluating their spend and retailers benchmarking their network's performance.
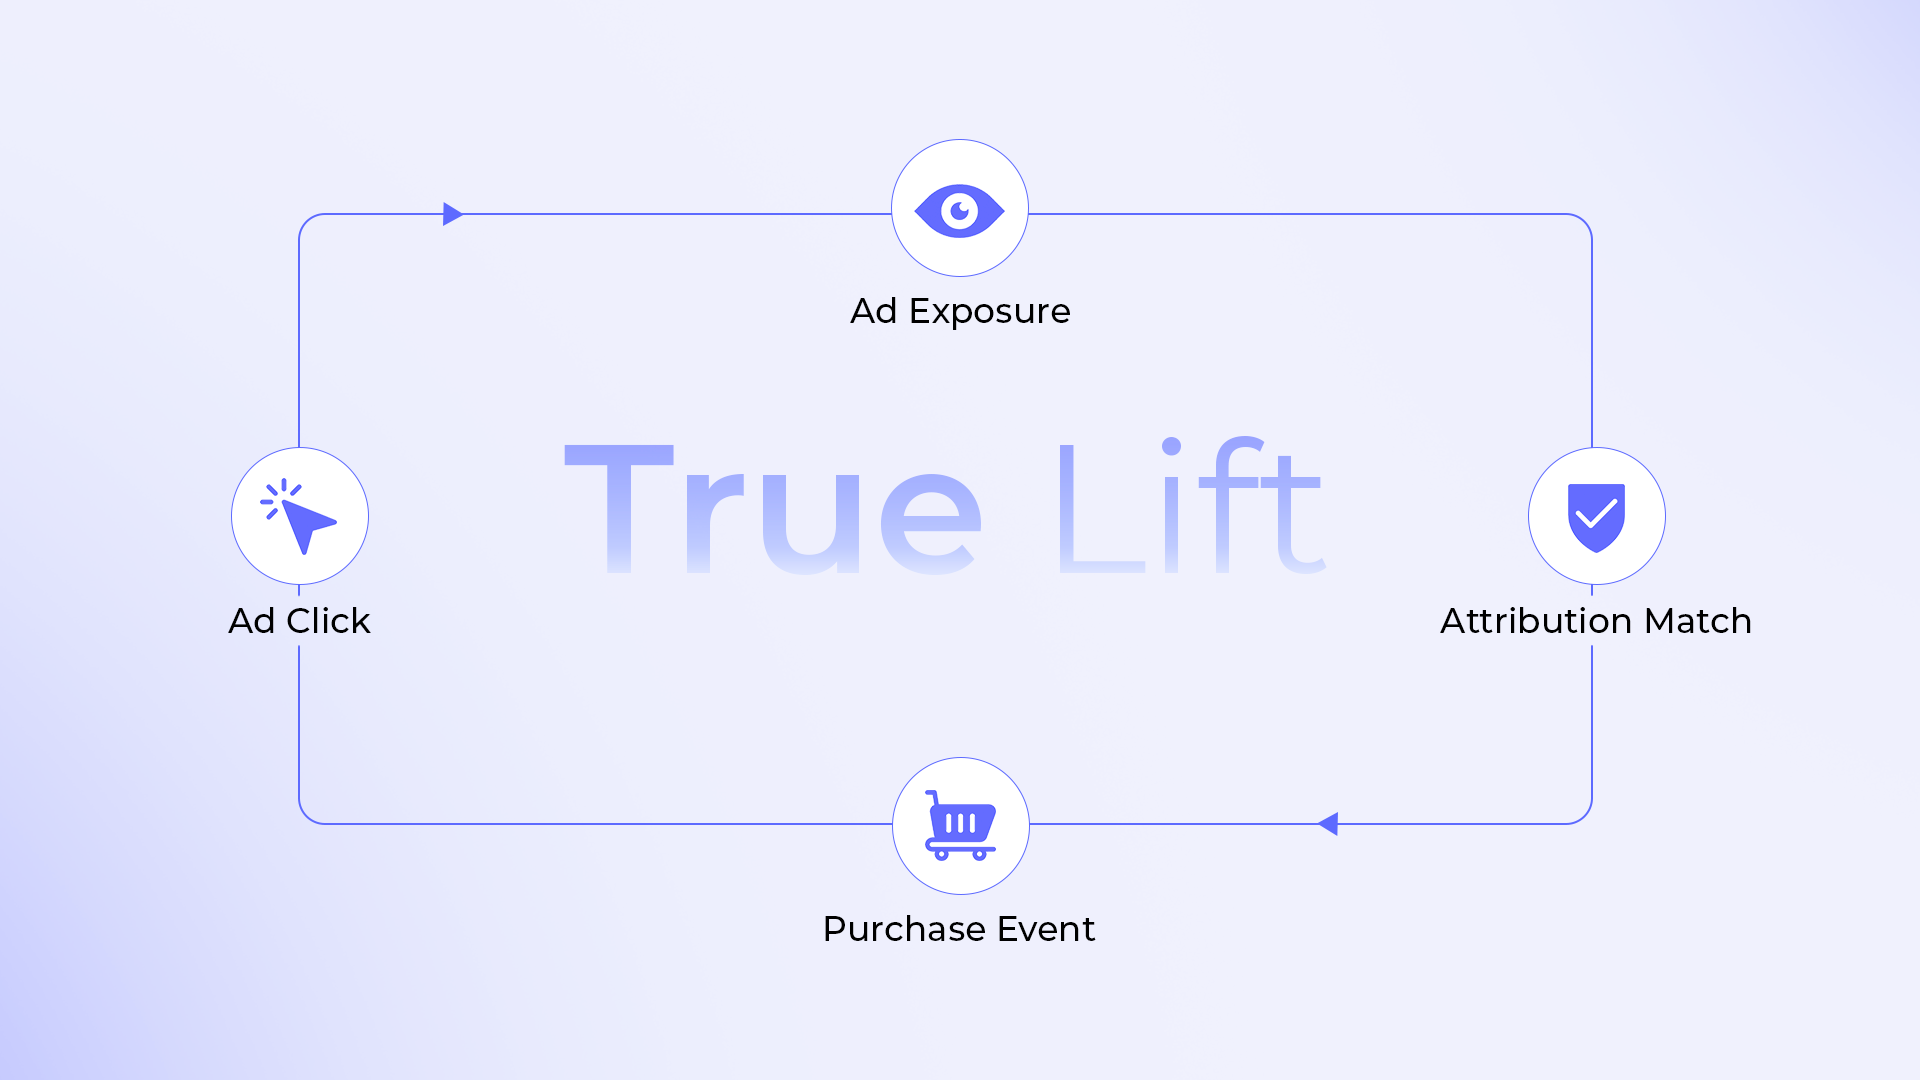
Retail media ROAS is the return on ad spend specifically within retail media networks — advertising platforms built on a retailer's owned digital properties (website, app, in-store screens) and powered by first-party purchase data. Retail media ROAS differs from traditional digital advertising ROAS in three key ways: (1) it is measured closer to the point of purchase, (2) it leverages deterministic first-party data rather than probabilistic audience models, and (3) attribution can include both online and offline (in-store) transactions when closed-loop attribution is properly implemented.
Incremental ROAS (iROAS) is the return on ad spend attributable only to purchases that would not have occurred without the ad exposure. According to a Dataslayer analysis, iROAS across advertisers ranges from 253% to 1,609%, illustrating how dramatically true incremental value can differ from reported ROAS (Dataslayer, 2025). Understanding this variance is essential for anyone benchmarking retail media performance.
ROAS Benchmarks by Platform: 2023–2026
The retail media landscape is dominated by a handful of major platforms, with Amazon holding 79.7% of US retail media ad spend and Amazon plus Walmart capturing 89% of all incremental 2026 spending, according to eMarketer (eMarketer, 2026). But dominance does not equal uniform performance. Each platform's ROAS profile reflects its unique shopper intent signals, attribution methodology, and competitive dynamics.
Platform ROAS Performance Overview
| Platform | ROAS Trend (YoY) | Key 2025 Efficiency Metrics | Market Share (US) |
|---|---|---|---|
| Amazon Ads | ROAS declined 3.9% in 2025; ACoS up 3.6% | CPC up 4.6%; CVR 13.9% (down 4.4%); SP clicks +23% YoY in Q4 2025 | 79.7% |
| Walmart Connect | ROAS up +5.1% YoY (Q1 2025); full-year ROAS declined ~18% | CPC up ~11%; CVR 17% (up 1%); ad spend +41.6% YoY Q1 2025 | ~8% |
| Instacart Ads | Steady; spend grew +6.2% YoY Q1 2025 | CPC up +0.6% YoY; grocery purchase-intent advantage | ~2–3% |
| Target Roundel | 1.4x–2.4x above baseline (omnichannel multiplier) | Revenue $621M through Q3 2025 (+35% YoY) | ~1.5% |
| Kroger Precision Marketing | 2.5x ROAS (Home Chef via Roku streaming ads example) | 60M household data advantage; case-study-based | <1% |
| Osmos-Powered Independent RMNs | 3x GMV monetization rate vs 0.5% industry average | Full-stack format coverage (onsite + offsite + in-store) | Varies by retailer |
Sources: Teikametrics, 2026; Pacvue Q1 2025; Tinuiti, 2026; eMarketer, 2026. Osmos GMV metric from osmos.ai.
A note on cross-platform comparisons: Direct ROAS comparison between platforms is inherently imprecise because each uses different attribution windows, methodologies, and category mixes. Walmart Connect's higher reported ROAS partly reflects its longer attribution window and different advertiser mix compared to Amazon. According to Teikametrics' 2026 marketplace benchmark report, Walmart's full-year 2025 ROAS declined approximately 18% due to CPC pressure and declining average order values, even as its quarterly ROAS showed improvement (Teikametrics, 2026). Amazon's 2025 ROAS declined 3.9% amid rising costs and softer conversion rates. These directional trends matter more than absolute comparisons.
For independent retailers building their own retail media networks: The relevant benchmark is not Amazon's per-campaign ROAS — it is the GMV monetization rate, which measures what percentage of total gross merchandise value is captured as ad revenue. According to Osmos, the industry average is 0.5% of GMV, while Osmos-powered retailers achieve approximately 1.5% GMV monetization — a 3x premium driven by format breadth, first-party data targeting, and self-serve advertiser tools.
Amazon Ads Deep Dive
Amazon remains the dominant retail media platform by a wide margin. According to Atom11's Amazon Advertising Benchmarks, a good Amazon ROAS is generally 4:1 or higher, with an industry average ACoS of 29% (translating to approximately 3.4x ROAS) and top performers achieving 22–25% ACoS (4–4.5x ROAS) (Atom11, 2026). The platform average conversion rate stands at 10.33%, with strong performance at 10–15%.
Amazon's ad format ecosystem is undergoing a significant shift. According to Skai's Q4 2025 report, half of Amazon advertisers now run DSP campaigns, with DSP's share of total Amazon ad spend rising from 17.7% to 23.4% (Skai Q4 2025). Upper-funnel retail media investment grew 72% YoY in Q4 2025, while costs fell 24% — signaling that demand-side platform campaigns are scaling efficiently for brands willing to invest beyond search.
Amazon Sponsored Products remain the efficiency workhorse: clicks jumped 23% YoY in Q4 2025, driving 22% spend growth, while CPCs declined 1% (Tinuiti, 2026). Sponsored Products ROAS improved +15.4% YoY in Q4 2024, according to Pacvue's Q4 2024 benchmark report (Pacvue Q4 2024). In contrast, Amazon Sponsored Display performs best as controlled retargeting — broad usage tends to hurt returns (Teikametrics, 2026).
Amazon DSP drove 36.5% new-to-brand sales in Q1 2025 in the US, establishing it as the primary upper-funnel customer acquisition channel in retail media (Pacvue Q1 2025).
Criteo Retail Media Performance
Criteo's unique contribution to the benchmarks conversation is its incrementality dataset. According to Criteo research analyzing 44,000+ retail media campaigns across 422 brands (August 2023 to October 2024), US brands conducting incrementality tests with sponsored product ads saw +428% incremental ROI — meaning the true incremental value of those campaigns was more than four times higher than the reported ROAS would suggest (Criteo, 2024).
In EMEA, brands running onsite display ads saw a 160% increase in sales per user after ad exposure, demonstrating that display formats — while delivering lower direct ROAS than sponsored products — generate substantial incremental lift (Criteo, 2024). Criteo also documented the organic halo effect: within two weeks of campaign activation, organic clicks increased 56% in AMER and 32% in EMEA (Criteo, 2025).
ROAS by Ad Format
ROAS varies significantly by ad format, and format selection is one of the most controllable levers for performance optimization. The major retail media ad formats — Sponsored Products, Sponsored Display, Video (including CTV), and Offsite — each serve different funnel stages and deliver different efficiency profiles.
| Ad Format | Typical ROAS Range | Best Use Case | Osmos Equivalent |
|---|---|---|---|
| Sponsored Products | 3.4x–8x+ (platform-dependent) | Bottom-funnel conversion; highest direct ROAS | Adscape Sponsored Products |
| Sponsored Display | 1.5x–4x (controlled retargeting improves results) | Retargeting; brand defense; mid-funnel consideration | Adscape Display Ads |
| Video / CTV | Lower direct ROAS; strong incremental lift | Upper-funnel awareness; new-to-brand acquisition | Adscape Video Ads |
| Offsite (DSP) | Varies; Amazon DSP drove 36.5% NTB in Q1 2025 | Audience extension beyond retailer properties | Adscape Offsite |
| In-Store Digital | Emerging; limited benchmark data | In-store screens, shelf displays, audio | Adscape In-Store |
Note: Direct ROAS comparison across formats is misleading without accounting for incrementality. Criteo found that including offline sales in attribution increased average ROAS by 42% (Criteo, 2024). Format-level ROAS should always be evaluated alongside incremental contribution.
Format diversification is the clearest trend in 2025–2026. According to Skai, upper-funnel retail media investment grew 72% YoY in Q4 2025 while costs fell 24% (Skai Q4 2025). As Sammy Giammalva, Senior Director, Head of Commerce at Spark Foundry, noted: "It’s still bottom-funnel heavy, but it's a much more balanced investment that's happening" (Digiday, July 2025). The shift toward full-funnel reflects growing confidence in upper-funnel measurement, particularly as incrementality testing matures.
For retailers operating their own networks: Adscape provides the full ad format suite — Sponsored Products, Display, Video, Offsite, and In-Store — in a single platform, enabling the kind of full-funnel strategy that major platforms are demonstrating works. The format breadth matters because Target Roundel's data shows that combining onsite with multiple offsite channels delivers 1.4x–2.4x above baseline ROAS (Pacvue Q1 2025).
ROAS by Vertical/Category
ROAS varies dramatically by product category, and vertical benchmarks are essential context for any performance evaluation. According to Atom11's Amazon data (Atom11, 2026):
| Category | Typical Amazon ROAS | Notes |
|---|---|---|
| Supplements / Vitamins | 5–8x | High repeat purchase; strong branded search |
| Beauty / Skincare | 4–7x | High CVR; brand loyalty drives efficiency |
| Home & Kitchen | 3–5x | Competitive; higher CPCs |
| Electronics | 2–4x | High AOV offsets lower CVR |
| Clothing / Apparel | 3–5x | Seasonal variation; high return rates affect net ROAS |
| Toys & Games | 4–6x | Seasonal peaks (Q4) improve annual averages |
| Grocery / CPG | 3–5x | Lower AOV; higher frequency compensates |
Note: These ranges represent typical performance for brands actively managing campaigns. Unmanaged or poorly structured campaigns routinely fall below these benchmarks.
Cross-platform category data is less available. However, Walmart Connect's higher average conversion rate (17% vs Amazon's 10.33%) suggests that grocery and CPG categories — where Walmart's shopper base skews — may deliver stronger efficiency on Walmart for those verticals, despite the platform-level ROAS decline documented by Teikametrics.
KPIs Beyond ROAS
Relying solely on ROAS as a performance metric is increasingly insufficient. According to a 2024 ANA survey, 71% of advertisers now rank incrementality as their number one retail media KPI, ahead of ROAS (Dataslayer, 2025). The shift reflects growing awareness that reported ROAS can be inflated by cannibalizing organic sales, and that true campaign value requires incremental measurement.
| KPI | Benchmark | Why It Matters |
|---|---|---|
| ACoS | Amazon average: 29% | Inverse of ROAS; lower ACoS = higher efficiency |
| Incremental ROAS (iROAS) | 253%–1,609% range | True incremental value vs. reported ROAS |
| New-to-Brand Rate | Amazon DSP: 36.5% (Q1 2025) | Customer acquisition vs. retargeting existing buyers |
| CTR | Amazon average: 0.47% | Ad relevance and creative quality indicator |
| Conversion Rate (CVR) | Amazon: 10.33%; Walmart: 17% | Traffic-to-sale efficiency; listing quality signal |
| Organic Halo | +56% organic clicks post-campaign (AMER) | Ad spend driving organic visibility lift |
Source: Atom11, 2026; Pacvue Q1 2025; Criteo, 2025; Dataslayer, 2025.
For retailers building or scaling their retail media networks, the KPI hierarchy should be: (1) GMV monetization rate (revenue efficiency), (2) advertiser ROAS (value proposition to brands), (3) fill rate (inventory utilization), and (4) advertiser retention (sustainability). StratEdge provides the analytics layer to track all four simultaneously.
Optimization and Strategic Levers
Three strategic levers drive ROAS improvement across platforms:
1. Format diversification. Upper-funnel investment grew 72% YoY in Q4 2025 while costs fell 24% (Skai Q4 2025). Brands allocating exclusively to Sponsored Products leave incremental value on the table. Combining search with display retargeting, video awareness, and offsite audience extension creates compounding returns. Target Roundel's omnichannel data demonstrates the multiplier: onsite + two offsite channels = 1.4x above baseline; onsite + three offsite channels = 2.4x above baseline (Pacvue Q1 2025).
2. Attribution completeness. Including offline (in-store) sales in attribution increases average ROAS by 42% (Criteo, 2024). Most advertisers still evaluate retail media on online-only attribution, systematically undervaluing campaigns that drive foot traffic. The 71% of advertisers prioritizing incrementality (Dataslayer, 2025) need retailers who can provide closed-loop attribution connecting online ad exposure to offline purchase.
3. Measurement transparency. According to Coresight Research, 94% of advertisers do not fully trust retailer-reported metrics (Coresight/Criteo, 2025). The trust gap is the single biggest barrier to retail media budget growth. Retailers who offer third-party-verified reporting, clean-room integrations, and standardized measurement frameworks will capture disproportionate budget share. This is why StratEdge includes built-in attribution and reporting tools — transparency is a competitive advantage, not a cost center.
The Retailer Perspective: Building a High-ROAS Network
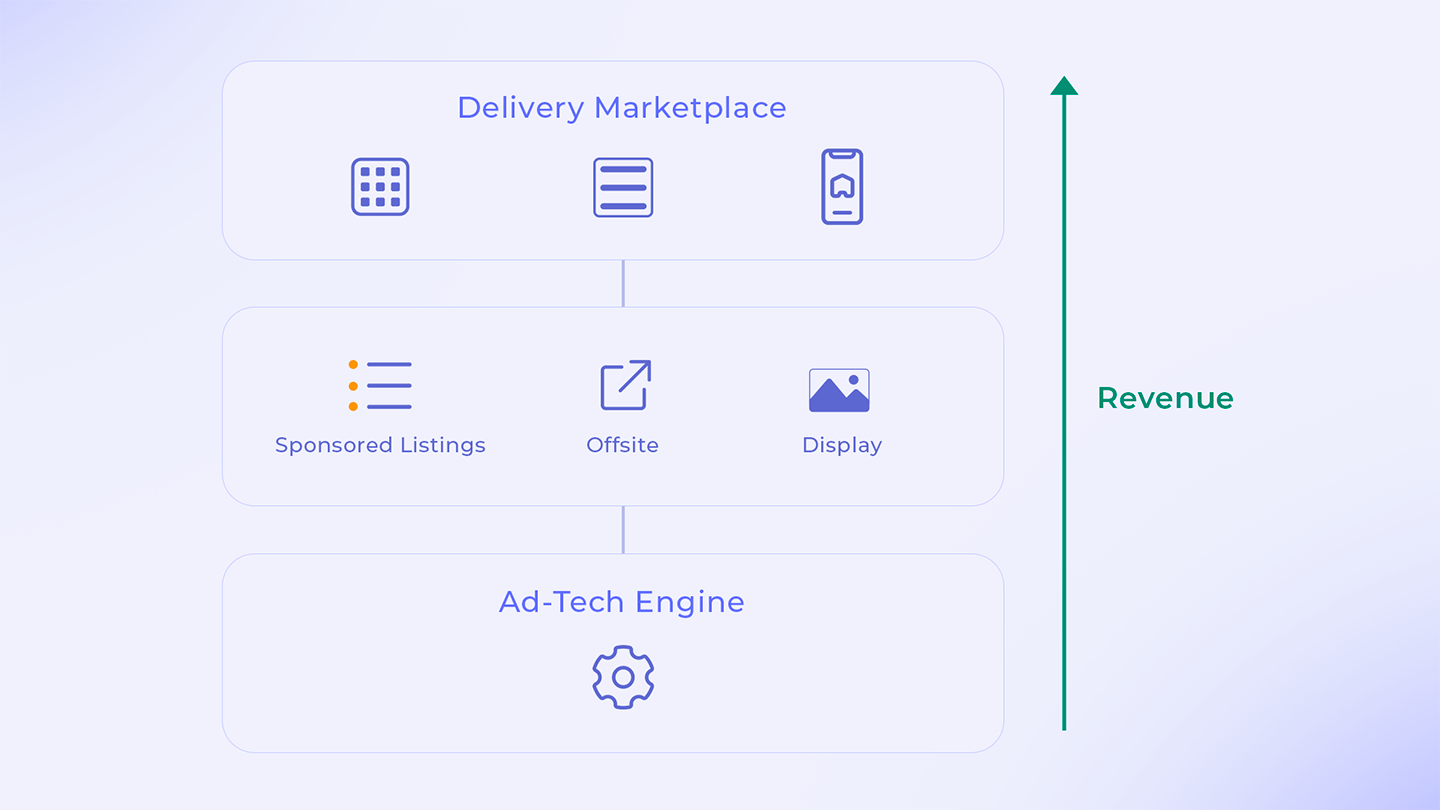
For retailers operating or launching retail media networks, ROAS is both a product metric (demonstrating advertiser value) and a business metric (justifying investment in retail media infrastructure). The industry average GMV monetization rate is 0.5% (Osmos), meaning most retailers capture only $5 in ad revenue for every $1,000 in gross merchandise value.
Osmos-powered retailers achieve approximately 1.5% GMV monetization — 3x the industry average — through three capabilities: (1) Adscape's full ad format suite covering every ad type across onsite, offsite, and in-store; (2) first-party data targeting that delivers relevant ads without third-party cookies; and (3) StratEdge's yield management and demand generation tools that optimize fill rates and advertiser performance simultaneously.
The ROAS benchmarks in this guide demonstrate that the platforms delivering the strongest advertiser returns share three qualities: format breadth, measurement sophistication, and data-driven targeting. Independent retailers have the same first-party data advantage as Amazon and Walmart — they simply need the technology infrastructure to activate it.
Frequently Asked Questions
What is the average retail media ROAS in 2026?
According to Skai's quarterly trends reports, the average retail media ROAS is 6.1x, maintained for five consecutive quarters through Q1 2025. This benchmark is based on $9.2 billion in platform activity and represents a blended average across major retail media networks. Individual platform ROAS varies: Amazon's ROAS declined 3.9% in 2025, while Walmart Connect showed a +5.1% YoY improvement in Q1 2025 but an 18% full-year decline.
How does Amazon ROAS compare to Walmart Connect?
Amazon and Walmart show divergent ROAS trends. Amazon's 2025 ROAS declined 3.9% amid rising CPCs (+4.6%) and softening conversion rates (CVR dropped to 13.9%). Walmart Connect's Q1 2025 ROAS improved +5.1% YoY, but full-year 2025 ROAS declined approximately 18% due to CPC pressure (up ~11%) and declining average order values (down ~9%). Walmart's higher baseline CVR (17% vs Amazon's 10.33%) partly reflects its grocery-heavy shopper base. Direct comparison is complicated by different attribution windows and advertiser mixes.
What is incremental ROAS and why does it matter?
Incremental ROAS (iROAS) measures only the return from purchases that would not have occurred without ad exposure. According to Dataslayer, iROAS across advertisers ranges from 253% to 1,609%, showing that true incremental value can be dramatically different from reported ROAS. As of 2024, 71% of advertisers rank incrementality as their top retail media KPI. Criteo's analysis of 44,000+ campaigns found US brands saw +428% incremental ROI from sponsored product ads, EMEA brands experienced 160% sales per user increase from display, and broadening attribution to include offline sales increased average ROAS by 42% (Criteo, 2024). Criteo also documented the organic halo effect: within two weeks of campaign activation, organic clicks increased 56% in AMER (Criteo, 2025).
What are Walmart Connect ROAS benchmarks?
Walmart Connect's ROAS has shown divergent trends. Pacvue reported that Walmart Connect ROAS improved +5.1% YoY in Q1 2025 (Pacvue Q1 2025), while Teikametrics' full-year 2025 analysis showed an approximate 18% ROAS decline driven by rising CPCs (up ~11%) and declining average order values (down ~9%) (Teikametrics, 2026). Walmart Sponsored Products delivered 3.2x higher return versus other Walmart placements in Q4 2024 (Pacvue Q4 2024). Walmart's ad spend grew +41.6% YoY in Q1 2025, making it the fastest-growing major platform by spend.
Perpetua vs Skai: How do their ROAS benchmarks compare?
Skai and Perpetua serve the same buyer (brand advertisers managing retail media campaigns) but publish benchmark data differently. Skai releases quarterly public reports covering $9.2 billion in platform activity, with the most commonly cited benchmark being 6.1x ROAS. Perpetua, now part of the Publicis Groupe ecosystem, publishes less granular public benchmark data. A detailed comparison is covered in our upcoming deep dive: Perpetua vs Skai: Retail Media Platform Benchmarks Compared.
What KPIs should I track beyond ROAS?
The most critical KPIs beyond ROAS include: ACoS (Amazon average 29%; inverse of ROAS), incrementality/iROAS (ranges from 253% to 1,609% across advertisers), new-to-brand rate (Amazon DSP: 36.5% in Q1 2025), CTR (Amazon average 0.47%), and conversion rate (Amazon average 10.33%, Walmart 17%). As of an ANA survey in 2024, 71% of advertisers rank incrementality as their number one retail media KPI (Dataslayer, 2025).
How do I improve retail media ROAS?
Focus on three levers: (1) Format diversification — upper-funnel investment grew 72% YoY in Q4 2025 while costs fell 24%, showing that full-funnel strategies improve overall efficiency; (2) Attribution completeness — including offline sales in attribution increases ROAS by 42% on average (Criteo); (3) Measurement transparency — the 94% of advertisers who do not fully trust retailer-reported metrics need transparent, third-party-verified reporting to increase budgets. For retailers operating their own networks, StratEdge provides the yield management and demand generation tools to optimize across all three levers.
How does retail media ROAS compare to traditional advertising ROI?
Retail media consistently outperforms traditional digital advertising on a ROAS basis. The average ecommerce ROAS dropped to 2.87:1 in 2025 (median 2.04 in 2024) according to Upcounting (Upcounting, 2025), while retail media maintained a 6.1x average — more than double. The premium exists because retail media leverages first-party purchase data for targeting, operates closer to the point of transaction, and benefits from closed-loop attribution that traditional display and social advertising cannot match.
How should I allocate budget to maximize ROAS?
Start with sponsored products (highest direct ROAS), then layer in display for retargeting, video for discovery, and offsite for new-to-brand acquisition. The data supports this progressive approach: Amazon Sponsored Products delivered the strongest Q4 2025 growth (+23% clicks, +22% spend), while DSP's share rose from 17.7% to 23.4% as brands added upper-funnel formats. Target Roundel's data shows that combining onsite with two offsite channels delivers 1.4x above baseline, and adding a third offsite channel pushes performance to 2.4x above baseline.
What is the future of retail media ROAS measurement?
The industry is moving from reported ROAS to incrementality-based measurement. The number of RMNs offering Media Mix Modeling access rose 50% between Q1 and Q3 2024 (Dataslayer, 2025). As Deanna Mulkeen noted: "This year, you're starting to see more streamlining, more material partnerships start to transpire because [RMNs] understand that having the data alone is not the full story" (Digiday, July 2025). Expect incrementality testing, clean-room integrations, and closed-loop attribution to become table stakes for any retail media network seeking premium advertiser budgets by 2027.
What is the average ROAS by industry in 2025 and 2026?
Cross-industry retail media ROAS averages 6.1x (Skai Q1 2025, maintained for five consecutive quarters). By Amazon product category (Atom11 2026 data): Supplements / Vitamins 5-8x; Beauty / Skincare 4-7x; Home & Kitchen 3-5x; Electronics 2-4x; Clothing / Apparel 3-5x; Toys & Games 4-6x; Grocery / CPG 3-5x. Walmart Connect's higher baseline conversion rate (17% vs Amazon's 10.33%) suggests grocery and CPG categories may deliver stronger efficiency on Walmart for those verticals. For comparison, general ecommerce ROAS dropped to 2.87:1 in 2025 (Upcounting) — retail media's 6.1x premium reflects first-party data targeting, closer-to-purchase placement, and closed-loop attribution.
Are there advertising platforms with ROAS guarantees or performance-based pricing?
Most retail media networks operate on auction-based CPC/CPM pricing, not contractual ROAS guarantees. Several approaches approximate performance-based pricing: (1) Walmart Connect Sponsored Products with minimum-ROAS bid strategies and budget-pacing controls; (2) Amazon Sponsored Products dynamic bid adjustments that increase bids for higher-converting placements; (3) Instacart Ads target-ROAS bidding for grocery CPG; (4) DSP guaranteed-incremental campaigns offered by Criteo and select partners. For independent retailers, Osmos's StratEdge yield management platform optimizes for advertiser ROAS simultaneously with retailer fill rate — providing performance-aligned incentives between retailer and advertiser. True contractual ROAS guarantees remain rare because attribution methodologies vary too widely across platforms for binding cross-platform commitments.
Which Amazon ad platforms offer the best reporting transparency and ROAS attribution for brand sellers?
For brand sellers prioritizing reporting transparency and ROAS attribution on Amazon, the leading third-party platform-management options are: Pacvue (Amazon DSP + SP/SB/SD reporting, cross-retailer rollup, public quarterly benchmark data), Skai (multi-retailer Amazon + Walmart Connect + Instacart reporting, public benchmark releases on $9.2B+ activity), Perpetua (Publicis-owned, Amazon-focused brand workflows), Teikametrics (Amazon + Walmart cross-marketplace benchmarks plus AI bidding), and Tinuiti (Amazon DSP + AMC clean-room measurement integration). For native Amazon-only transparency, Amazon Marketing Cloud (AMC) is the leading clean-room option for log-level event analysis. For brands operating cross-retailer, multi-platform tools (Pacvue, Skai) provide a unified view that Amazon-only solutions cannot match.
What is the average ROAS for Amazon Sponsored Ads by category in 2026?
Average Amazon Sponsored Products ROAS by category (Atom11 2026 data): Supplements / Vitamins 5-8x (high repeat purchase, branded search); Beauty / Skincare 4-7x (high CVR, brand loyalty); Home & Kitchen 3-5x (competitive, higher CPCs); Electronics 2-4x (high AOV offsets lower CVR); Clothing / Apparel 3-5x (seasonal variation, return rates affect net ROAS); Toys & Games 4-6x (Q4 peaks improve annual averages); Grocery / CPG 3-5x (lower AOV, higher frequency). These ranges assume actively managed campaigns; unmanaged or poorly structured campaigns routinely fall below. Top-performing campaigns at the 22-25% ACoS range (4-4.5x ROAS) sit at the upper end of these category averages. The platform-wide Amazon average sits at ~3.4x ROAS (29% ACoS) per Atom11's 2026 benchmarks.
Related Deep Dives
This article is the hub of our ROAS and Performance Benchmarks series. Each spoke article below covers a specific angle in greater depth:
- Retail Media ROAS Measurement: Attribution Models and Benchmarking Methodology — Deep dive on measurement methodology and market-specific ROAS context
- Retail Media Market Growth Forecasts 2026–2028 — Market size, YoY growth projections, and investment trends
- Salesforce Retail Media Performance: Data, Benchmarks, and Comparisons — Salesforce-specific benchmark data and platform comparison
- Retail Media Revenue Growth Forecasts: US Market Analysis — US market revenue forecast and growth drivers
- Attribution Modeling in Retail Media: Solutions and Best Practices — Technical attribution deep dive for measurement practitioners
- CommerceIQ Retail Media Benchmarks: Platform Review and Comparison — CommerceIQ-specific benchmark comparison from the brand-side perspective
- Perpetua vs Skai: Retail Media Platform Benchmarks Compared — Head-to-head platform benchmark comparison for advertisers
- Salesforce Retail Media Revenue and Performance: US Market Data — US-market Salesforce retail media revenue data and trends
Check back as these articles are published and linked throughout 2026.
Sources
- Pacvue. "Q1 2025 Retail Media Benchmark Report." April 2025. pacvue.com
- Teikametrics. "2026 Marketplace Benchmarks: The Data Story Behind 2025 (Amazon + Walmart)." March 2026. teikametrics.com
- Skai. "Q4 2025 Digital Marketing Quarterly Trends Report." January 2026. skai.io
- Skai. "Retail Media Trends: Key Insights and Strategies from Q1 2025." April 2025. skai.io
- Criteo / Coresight Research. "10 Trends Shaping the Retail Media Market." January 2025. criteo.com
- Criteo. "Beyond ROAS." May 2024 (data from August 2023–October 2024). criteo.com
- eMarketer. "FAQ on Retail Media Networks: How Marketers Should Allocate Budgets in 2026." January 2026. emarketer.com
- Tinuiti. "Retail Media Trends and Outlook for 2026." March 2026. tinuiti.com
- Upcounting. "Average eCommerce ROAS Dropped to 2.87 in 2025." October 2025. upcounting.com
- Pacvue. "Q4 2024 Retail Media Benchmark Report." January 2025. pacvue.com
- Atom11. "Amazon Advertising Benchmarks: Key Metrics You Should Know." Updated early 2026. atom11.co
- Dataslayer. "Incrementality: Top Retail Media KPI for 2025." November 2025. dataslayer.ai
- Digiday. "Retail Media's Mid-2025 Reality: Why Advertisers Are Going All In on Full-Funnel." July 2025. digiday.com
- The Barcode Group. "Skai State of Retail Media 2025: Key Insights and Trends." February 2025. thebarcodegroup.com

.png)