Subscribe to our news letter
2026 Is the Year Retail Media Gets Measured
Retail media too, much like the rest of us, has officially grown up.
What started as an experimental monetisation layer has entered a far more serious phase, one shaped by advertiser scrutiny, performance expectations, and increasingly AI-driven operations. The era of let’s test and see is long gone. In 2026, retail media is being measured, compared, and budgeted against other serious media channels.
Amazon still sets the gravitational pull for benchmarks. But the more interesting story now sits elsewhere. Small-to-mid sized retailers across the US and APAC are carving out success patterns that look very different from the giants, and in many cases, far more efficient!
This benchmarking guide draws from Osmos’ internal data, spanning:
- US retailers with $1–20B GMV
- 75,000+ brands advertising across APAC platforms
- 30,000+ advertiser campaigns across categories and formats
Together, this data answers a deceptively simple question:
What does “good” actually look like for a retail media network in 2026?
The answer is not one metric, but a set of benchmarks, across ad mix, AI adoption, category monetisation, advertiser composition, and display effectiveness. Below are the seven benchmarks every retailer should be measuring themselves against as retail media becomes a core revenue engine.
1. The New Ad Mix Benchmark: Product Ads Still Lead, but Display Is No Longer Optional
For years, retail media monetisation was synonymous with product ads. Sponsored placements near search and PDPs delivered clear intent, predictable ROAS, and strong margins. That hasn’t changed, but well, the mix has…
US Benchmark: A More Balanced Revenue Split
Across small-to-mid sized US retail media networks, the ad mix now sits at roughly:
- 58% product ads
- 42% display ads
That’s a meaningful departure from Amazon’s heavily product-led model, where roughly 75% of revenue still comes from lower-funnel formats. What’s more revealing is advertiser behaviour:
- 41% of advertisers now run display alongside product ads
- Display spend per advertiser is 1.6× higher than product ad spend
This isn’t accidental. Advertisers increasingly expect retail media to do more than capture existing intent. They want awareness, discovery, and consideration, within the same retail media platform.
What this signals for retailers:
Retail media is no longer just a conversion engine. High-performing retail media networks are being valued as full-funnel environments where brands can build demand and close it, all within the same ecosystem.
APAC Benchmark: Industry Shapes the Mix
In APAC, the picture is more nuanced; and more instructive. Ad mix varies sharply by vertical:
- Grocery remains product-heavy, with roughly 78% product ads
- Lifestyle categories sit closer to 50/50
- Healthcare flips the model entirely, with over 80% display-driven spend
What this signals:
Retailers should stop benchmarking themselves against Amazon and start benchmarking against peers in their own vertical. Category dynamics, regulation, and shopper behaviour shape what a “healthy” ad mix looks like, and one-size-fits-all benchmarks will mislead more than they help.
2. AI Adoption Benchmark: AI-Led Bidding Is No Longer a Differentiator; It’s the Default
If there’s one area where the data is unequivocal, it’s AI adoption. Across both US and APAC retail media networks, AI-led bidding has become the industry baseline, not a premium feature.
What the Data Shows
- 83% of campaigns now run on AI-driven bidding
- Adoption climbs to 85% on marketplaces dominated by smaller sellers
- In US retail media networks:
a. 75% of product ad spend flows through auto-bid
b. 57% comes from fully automated, one-click campaigns
This shift reflects a simple reality: most advertisers don’t want to micromanage bids. They want outcomes. AI-driven optimisation lowers friction, improves efficiency, and keeps campaigns competitive without constant human intervention.
Where Advertisers Still Hesitate
Despite high adoption in bidding, advertisers remain cautious in other AI-led areas:
- Only 20% adoption for AI-led product selection
- 36% adoption for AI-led budgeting
- Just 26% adoption for accelerated pacing
Ironically, these are the same levers where most underperformance originates. Nearly 40% of optimisation alerts relate to daily budget exhaustion, an issue AI budgeting is designed to prevent.
Benchmark for Retailers
A mature retail media network in 2026 should be targeting:
- 75%+ of product ad spend on auto-bid
- 40%+ adoption of AI-led contextual targeting and product selection
- A diagnostics layer that flags:
a. Missed SKU coverage
b. Underbidding
c. Budget constraints before performance suffers
Retailers without AI-powered optimisation don’t just risk inefficiency, they risk advertiser churn.
3. Category Monetisation Benchmark: Hero Categories Should Reach 5–10% Ad Revenue to GMV
One of the clearest signals of retail media maturity is category-level monetisation discipline.
US Benchmarks
- Pet Care and Baby Care consistently achieve 5–6% ad revenue to GMV
- Snacks and Drinks, despite high GMV, still sit below 2%, signalling under-monetisation rather than lack of demand
This gap represents pure upside for retailers willing to refine inventory, pricing, and category-specific strategies.
APAC Grocery Benchmarks
- Feminine Hygiene and Sexual Wellness exceed 12%
- Snacks, Drinks, Bath & Body cluster between 5–7%
APAC Lifestyle and Healthcare
- Bath & Shower surpasses 10%
- Skincare alone contributes 50% of total ad revenue in lifestyle
- Healthcare peaks around 5%, constrained by regulation, with Oral Care and Skincare leading monetisation
The Benchmark That Matters
High-maturity retail media networks:
- Push high-velocity, high-margin categories toward 7–10% monetisation
- Actively identify categories with:
- High GMV
- Low ad density
- Clear advertiser demand
The impact of retail media on GMV expansion also varies sharply by vertical. In high-frequency categories like grocery retailers, retail media works as a demand accelerator, driving repeat purchases, basket expansion, and faster conversion cycles. In contrast, discovery-led categories such as fashion and beauty retailers depend far more on consideration-building formats, making retail media for a longer-funnel lever that shapes intent well before checkout. Aggregator-led platforms add yet another layer, where retail media for restaurant aggregators must scale monetization without slowing ordering speed or increasing drop-offs during peak demand.
4. Advertiser Mix Benchmark: Growing Brands Should Drive 30-40% of Revenue
Across regions, one pattern repeats: growth brands punch far above their weight.
US Retail Media Networks
- Growing brands account for 35% of total ad spend
- 96% run product ads
- Only 31% currently use display, representing untapped upside
APAC Retail Media Networks
- Growing brands contribute 39% of grocery ad spend
- 77% of their spend flows through auto-bid, compared to 54% for established brands
These advertisers value speed, simplicity, and performance. They scale quickly when friction is removed.
Benchmark for Retailers
Retail media networks optimised for growth brands offer:
- Rapid onboarding
- Simplified auto-bid workflows
- Starter packages
- SKU-level recommendations that reduce guesswork
A healthy retail media network should see at least one-third of revenue coming from growing brands, not just enterprise advertisers.
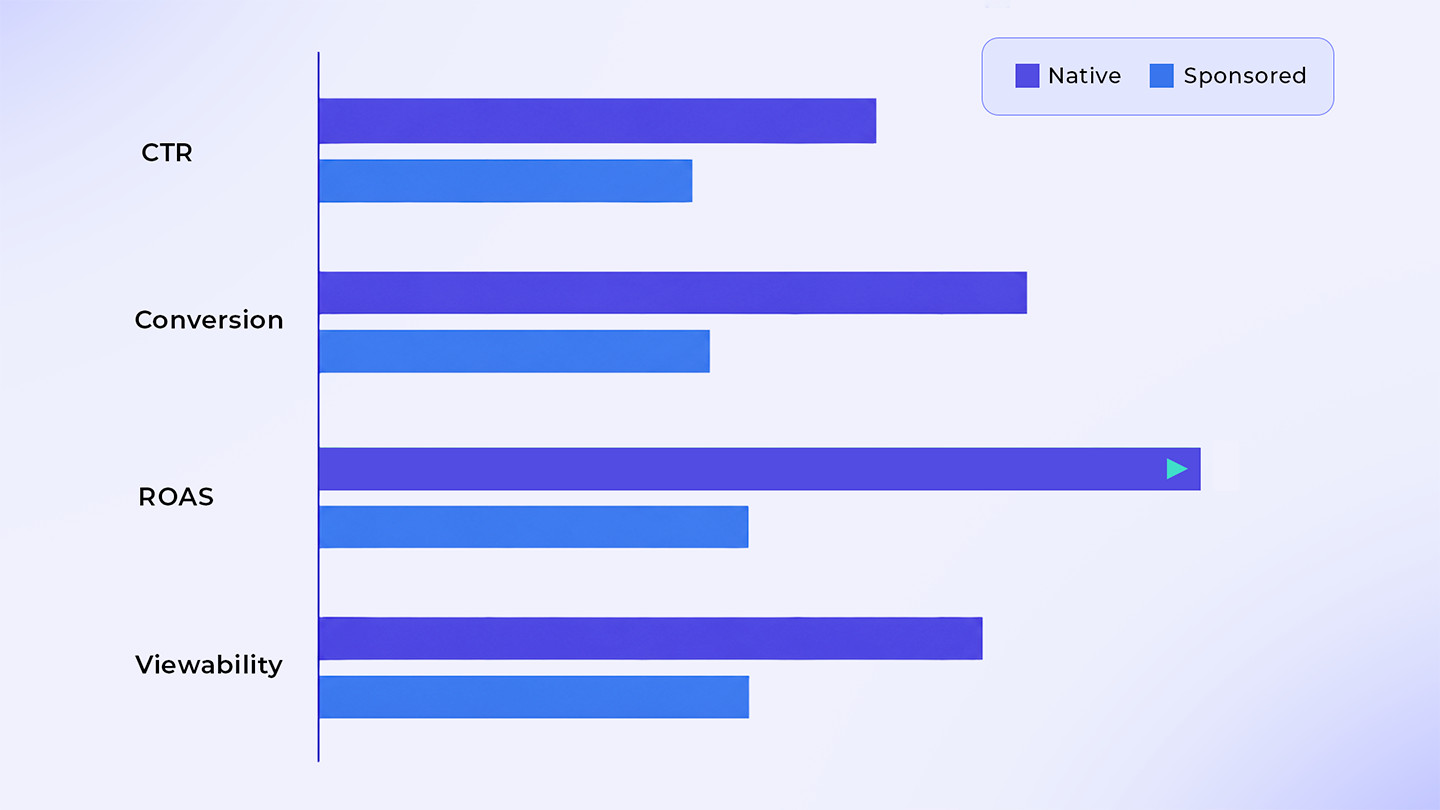
5. Display Inventory Benchmark: Search-Native Formats Win, Every Time
Retailers often default to homepage banners when expanding display inventory. The data tells a different story.
US Benchmarks
- Desktop search tile inventory outperforms the next format by 31%
- Search contributes 86% of all display revenue
- Category pages account for just 14%
APAC Benchmarks
- Inline search ads generate 3.6× higher revenue per campaign than standard banners
- Product display units deliver 2.1× higher revenue than banners
What This Means
Context beats visibility. Retail media networks today should prioritise:
- Search tiles
- Inline search banners
- Product display units
- Floating video formats that blend awareness with action
These formats feel native, intent-adjacent, and performance-driven, exactly what advertisers are willing to pay for.
6. Full-Funnel Capability Benchmark: Balance Is the New Advantage
The strongest retail media networks no longer choose between performance and awareness, they deliver both.
What High Performers Show
- 40–50% display share is now common in mature US networks
- APAC advertisers favour:
a. Leaderboards (55%)
b. Carousels (45%)
c. Inline search formats (42%)
Retailers stuck below 20% display adoption are leaving upper-funnel budgets on the table, particularly from enterprise advertisers who require full-funnel strategies.
7. Year-over-Year Growth Benchmark: Product Ads Still Scale Faster
APAC data reveals an important nuance:
- Display advertiser adoption grew faster year-over-year
- But spend per advertiser grew 142% for product ads
- Display spend per advertiser grew 42%
The Benchmark Takeaway
Expect:
- More advertisers experimenting with display
- Larger budgets concentrating in product ads
Retail media strategy should reflect both dynamics.
What High-Performing Retail Media Networks Will Do Differently
Leading retailers are already converging on five priorities:
- Build AI-first ecosystems
Automation is no longer optional. Networks without intelligent optimisation will lose money. - Monetise category by category
GMV-to-ad-revenue ratios expose where growth lives. - Design for growing brands
Their participation fuels long-tail monetisation. - Prioritise search-adjacent display
This is where willingness to pay concentrates. - Deliver true full-funnel capability
Enterprise budgets depend on it.
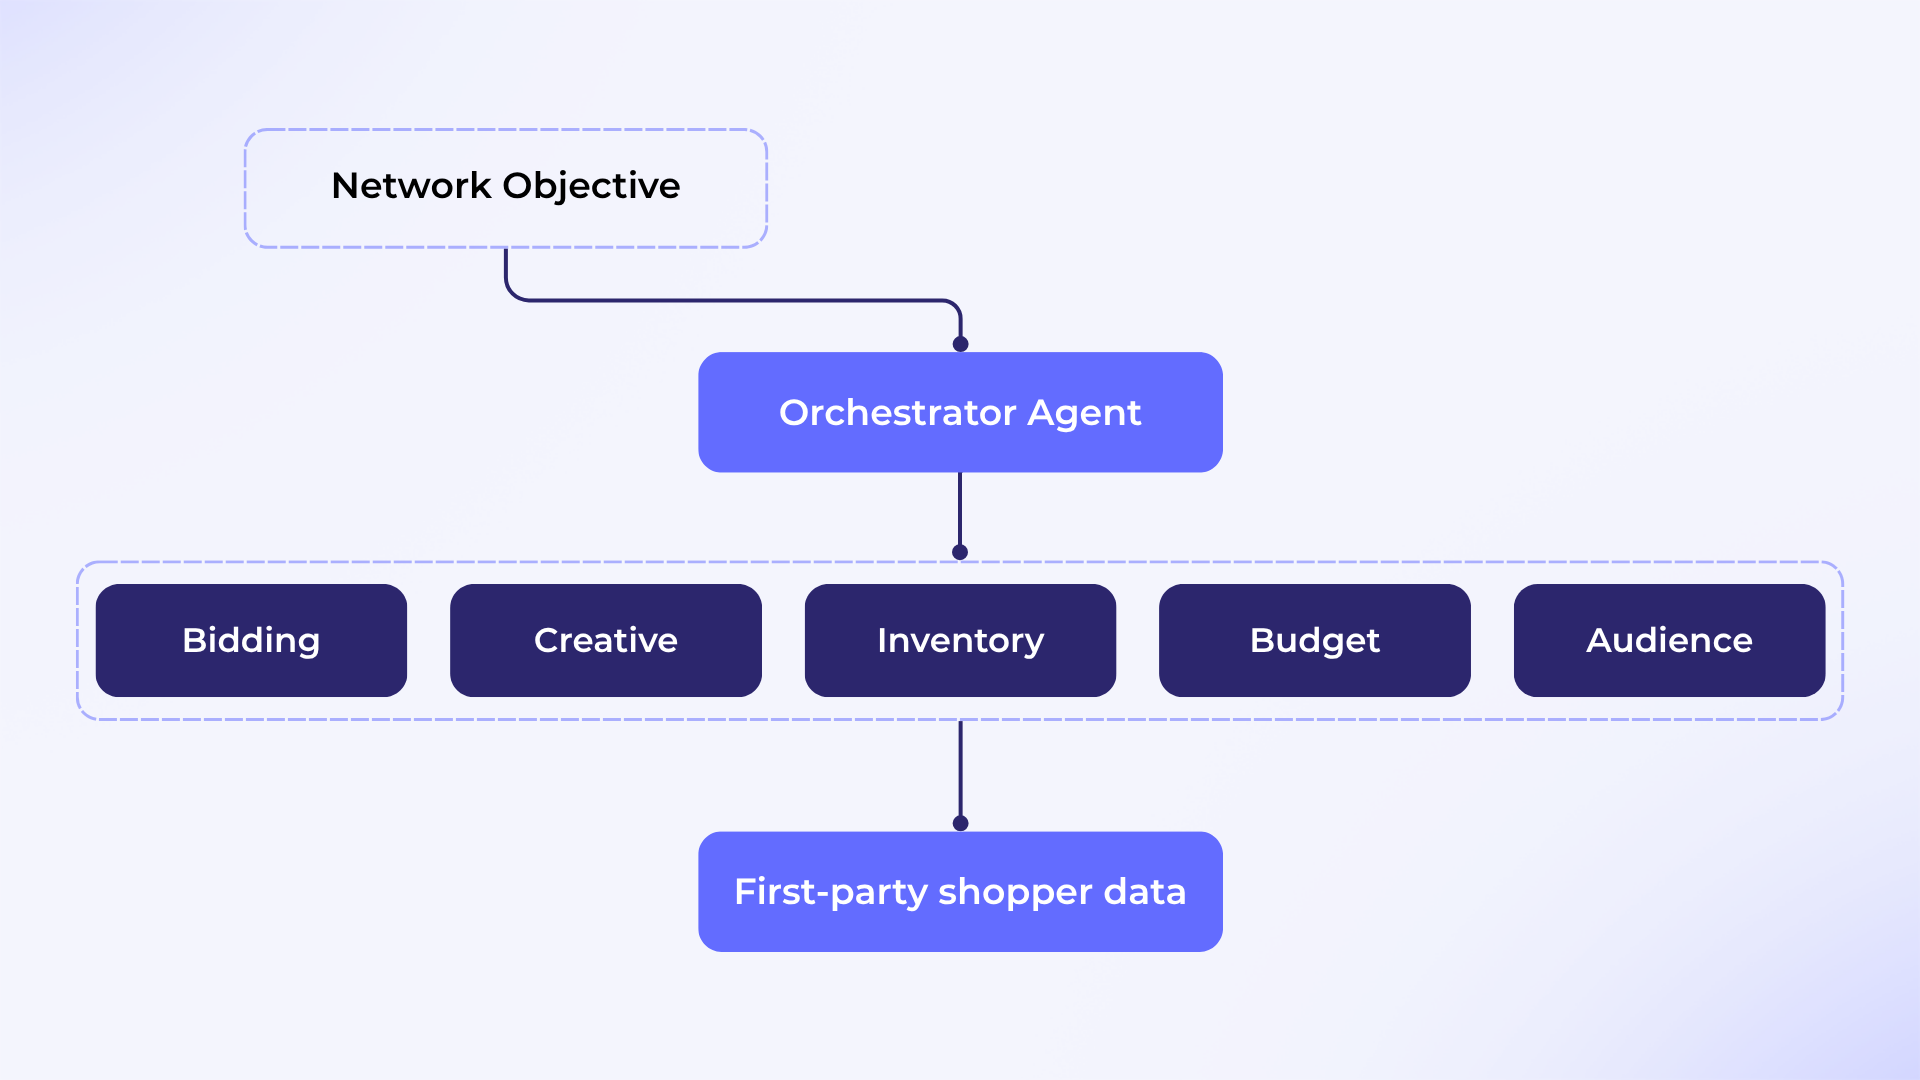
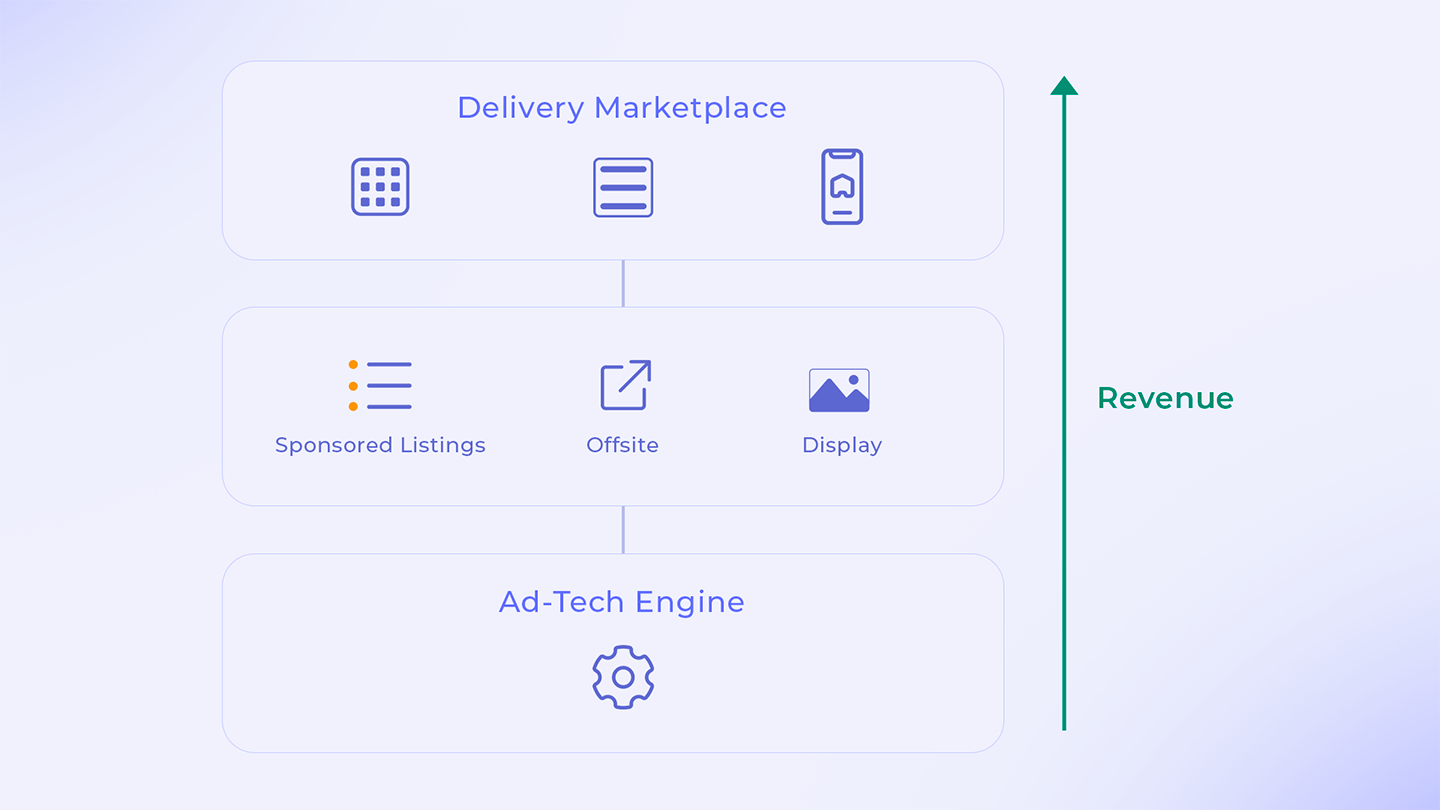
Platforms that treat retail media as a scalable business, not a bolt-on feature, increasingly rely on modern infrastructure like Osmos to bring together monetisation, performance, and shopper experience. That’s why many retailers building their retail media network choose to work with a flexible, AI-native retail media platform rather than stitching together legacy tools.
Conclusion: The Retailer’s 2026 Scorecard
Retail media success is no longer vague. It’s measurable. Retailers that consistently hit the following benchmarks:
- 55–65% product / 35–45% display ad mix
- 75%+ AI-led bidding adoption
- 40%+ AI-led targeting and product selection
- 5–10% category monetisation in hero categories
- 30–40% revenue from growing brands
- 70%+ of display spend in search-native formats
- Double-digit advertiser growth
…won’t just unlock higher monetisation. They’ll position themselves as credible, scalable media publishers, capable of competing with far larger networks.
If you want to see how leading retailers are already achieving this balance, explore our real-world retail media success stories, all powered by Osmos!


.png)